Posts

Showing posts with the label population

The US Population - a #Visualization in Canadas

Image
via isomorphismes  via who knows, the population of the USA in "Canada-Units"

Race & Sex on American TV - a #Visualization

Image
Amptoons puts Alyssa Rosenberg's count of the race and sex of characters on prime-time TV up against the same for the USA as a whole.  The conclusions? Asian & Latinos get short shrift  Law Enforcement is all over the place Check it out...

Where to live when you are old - a #Visualization

Image
HelpAge  now has The Global AgeWatch Index , which ranks countries by how well their ageing populations are faring. It is based on four domains that are key enablers of older people's wellbeing: income, health, employment and education, and enabling environment. It basically looks at the quality of life for (89% of) the world's population across the 91 measured countries. The Best? Sweden of course The Worst? Afghanistan... Mind you, this assumes that you get to Retire :-) Go there to get the gory details , or check out the interactive map below

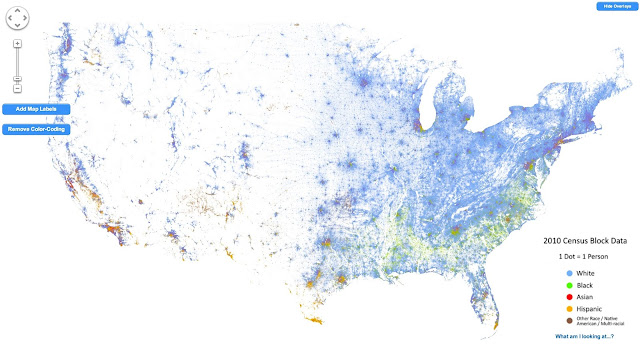
America - Visualized as a Racial Dot Map

Image
Dustin Cable does the honors here - mapping the population of the USA as a dot-map. Literally a dot-map, as in one dot per person .  This is not unlike the original dot map , but the coloring provides a racial breakdown. I still find it fascinating how pretty much the entire Western USA is empty... Anyhow, as he puts it This map is an American snapshot; it provides an accessible visualization of geographic distribution, population density, and racial diversity of the American people in every neighborhood in the entire country. The map displays 308,745,538 dots, one for each person residing in the United States at the location they were counted during the 2010 Census. Each dot is color-coded by the individual's race and ethnicity. The map is presented in both black and white and full color versions. In the color version, each dot is color-coded by race. All of the data displayed on the map are from the U.S. Census Bureau's 2010 Summary File 1 dataset made publicly available...

The U.S. population - Visualized as multiples of Canada

Image
Isomorphismes has this great map showing the the U.S. population as multiples of the Canadian one ...

Frightening statistic of the day - Incarceration Rates

Image
From Invisible Men: Mass Incarceration and the Myth of Black Progress by Becky Petit. Five percent of white men and 28 percent of black men   born between 1975 and 1979 spent at least a year in prison before reaching  age thirty-five. The risks of spending time in prison for this birth cohort were  significantly higher among high school dropouts: 28 percent of white and 68 percent of black dropouts had spent at least a year in prison by 2009 (emphasis mine).  If this doesn't give you pause, well, it should. But wait, it gets worse.  Check out the following stats > 1% of American adults is living in prison >3% of American adults is under some form of correctional supervision  (probation, parole, etc.) Shortly, >30% of black men will have served time in prison Keep those numbers in mind as you walk around today. And remember, this isn't happening in " that bad neighborhood over on the other side of the tracks ", its happening everywhere ...

The American Population - Visualized (as a dotmap)

Image
Brandon Martin-Anderson does the heavy lifting, mapping every single person counted in the 2010 census . Thats 308,450,225 dots (technical term - "a lot of dots").  The image above is just that - an image.  Go to the source to see the actual - interactive - visualization . From the source What's all this? This is a map of every person counted by the 2010 US Census. The map has 308,450,225 dots - one for each person. Why? I wanted an image of human settlement patterns unmediated by proxies like city boundaries, arterial roads, state lines, &c. Also, it was an interesting challenge. Who is responsible for this? The US Census, mostly. I made the map. I'm   Brandon Martin-Anderson. Kieran Huggins   came to the rescue with spare server capacity and technical advice after this got Boing Boing'd. How? I wrote a Python script to generate points from US Census block-level counts, and then generated the tiles with Processing. Here's   more deta...

Suburban Sprawl - A Red-stater's best friend

Image
Dave Troy has a couple of fascinating charts showing voting patterns vs population density  from this election - and the results should be pretty alarming for Republicans. First, the election results (click to embiggen. A lot) Note that below 800 people per square mile, people vote Republican, but above it, people vote Democratic. (Ignore the x-axis scale changing at 190 - otherwise the chart would get huge ). Or, to put this slightly differently, any densely populated area will vote Democratic .  But, we pretty much knew this, i.e., your default election results tend to show that the sparsely populated states are all Red, and the highly populated states are all blue (with the rest somewhere in between) Looking at this a wee bit deeper though makes things a whole lot more interesting. I'll let Dave explain this himself Studying this graph, two important facts are revealed.   First, there are very few cities in red states. Second, the few dense cities th...