Posts

Showing posts with the label maps

Mercator Maps are Bizarre - Reason #67

Image
via Drew Roos The Mercator projection is infamous for its distortion at high latitudes. This distortion gets exponentially worse as you approach the poles. It is in fact impossible to show the poles on a Mercator map — they are infinitely far away. Any Mercator map you've ever seen must cut off the top and bottom edges at some arbitrary point. The map stops short hundreds, if not thousands of miles away from the poles. His solution - redo the Mercator, centered on wherever you want (e.g., where you live), and reduce the cutoff to make it somewhat mind-boggingly tall To make things actually interesting, we must artifically shift the pole of the project to a more interesting place. Imagine the earth encased by a rigid cage of latitude and longitude lines. We rotate the earth while leaving the cage fixed until a new point of interest has taken the place of the North Pole. This is called an   oblique Mercator , and is normally used to shift an area of interest onto the e...

Maps - the greatest thing since...Maps!

Image
Check it out! They're cool! They're revolutionary! They're portable! Maps!

New Jersey - Visualized

Image
Via Don's Notes , we have this collection of NJ Cultural/Ethnic stereotypes in one map... (click to embiggen quite a bit)  

The world according to Indians - Visualized

Image
via Siddharth Singh (hat-tip Ajay Bhardwaj) I'm a particular fan of the Canada-ization of Nepal (" The 29th State "), though Switzerland (" Shah Rukh Khan dances here ") is a close second :-)

Election Maps - Various types

Image
The standard (Red vs Blue) map that you always see ( via Newman ) The US map squished around to make the state sizes proportional to the population ( still via Newman ) A pointillist take from Nelson . Click to embiggen (a lot !)   To quote "a pointillist look at the 2012 election results, which does a fairer job of illustrating where, how many, and how people voted in the election than the more typical full-color generalization." And my favorite - the map based on political Ad spending   using dollars per Voter as the metric

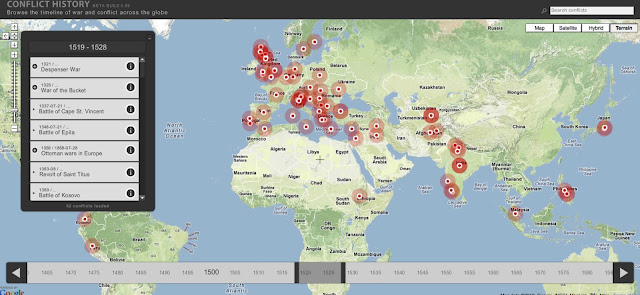
The History of Conflicts through Google Maps

Image
From conflicthistory.com comes this Visualization Gem - a Google Mapped timeline of (AFAICT) every conflict in human history. Ok, it may not have this one time when I got in a fight in 2nd grade, but boy howdy, is it every comprehensive - pretty much everything from 3000BC through 2005. As an added bonus, you can click on the marker and pop over to the associated wikipedia entry. The image below is just that, an image (albeit a humongous one).  Click here to go to the actual site and have your mind blown..

Cartography Coolness - Watercolor Maps

Image
From the genii at Stamen Design , we have these embeddable / usable watercolor maps As they put it “Reminiscent of hand drawn maps, Stamen’s new watercolor tiles apply area washes and organic edges over a paper texture to add warm pop to any map. We’ve added more Photoshop-style raster effects to TileStache to render OSM tiles like you’ve never seen them before.” There is a post on their blog here describing how these maps are generated - check it ou t... (The image below is not interactive...)