Posts

Showing posts with the label Election2012

Why Romney won the Republican primary in 2012

Image
From Wonkette Romney won because he was less stupid than Perry and Bachmann and more superstitious than Huntsman. Romney became the nominee the same way Ramen noodles become dinner: There’s nothing else around, and you have to pick something. And the Hot Pockets believe in evolution. Stroke of genius....

Suburban Sprawl - A Red-stater's best friend

Image
Dave Troy has a couple of fascinating charts showing voting patterns vs population density  from this election - and the results should be pretty alarming for Republicans. First, the election results (click to embiggen. A lot) Note that below 800 people per square mile, people vote Republican, but above it, people vote Democratic. (Ignore the x-axis scale changing at 190 - otherwise the chart would get huge ). Or, to put this slightly differently, any densely populated area will vote Democratic .  But, we pretty much knew this, i.e., your default election results tend to show that the sparsely populated states are all Red, and the highly populated states are all blue (with the rest somewhere in between) Looking at this a wee bit deeper though makes things a whole lot more interesting. I'll let Dave explain this himself Studying this graph, two important facts are revealed.   First, there are very few cities in red states. Second, the few dense cities th...

Election Maps - Various types

Image
The standard (Red vs Blue) map that you always see ( via Newman ) The US map squished around to make the state sizes proportional to the population ( still via Newman ) A pointillist take from Nelson . Click to embiggen (a lot !)   To quote "a pointillist look at the 2012 election results, which does a fairer job of illustrating where, how many, and how people voted in the election than the more typical full-color generalization." And my favorite - the map based on political Ad spending   using dollars per Voter as the metric

Robust Software - Really, *REALLY* Hard To Do...

Image
You may have heard of Project ORCA the Romney Campaign's massive high-tech Get Out The Vote effort in 2012, which failed, and spectacularly at that.  As John Ekdal put it By 2PM, I had completely given up. I finally got ahold of someone at around 1PM and I never heard back. From what I understand, the entire system crashed at around 4PM... So, the end result was that 30,000+ of the most active and fired-up volunteers were wandering around confused and frustrated when they could have been doing anything else to help From all appearances, it was a combination of lack of robustness , lack of scalability , and a pernicious consultant culture that doomed it. This wasn't the first time I'dseen problems of this type, and it almost certainly won't be the last.  The underlying issue was pretty standard. - basically, the word "Robust" takes on a whole new meaning when failure is not  an option. This is really important, and worth repeating loudly -   ...

The Popular Vote - Deconstructed by Ethnic Diversity

Image
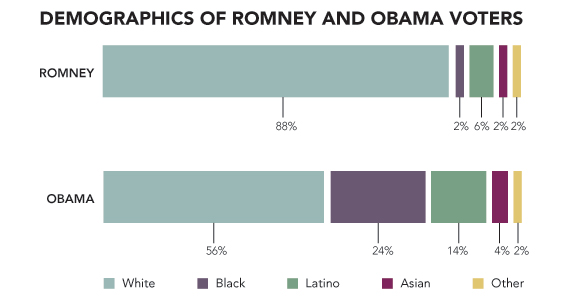
CNN, strangely, has some gems buried in its exit polling data from the 2012 elections .  I say strangely , because they seem to have gone full " faux wonk " in their attempt to be The Data Company, or whatever the heck their current strategy is. Anyhow, the particularly interesting bit here is the chart showing Vote By Race , which I've summarized below Vote by Race Percentage of Vote % Split for Obama % Split for Romney Other White 72 39 59 2 African-American 13 93 6 1 Latino 10 71 27 2 Asian 3 73 26 1 Other 2 58 38 4 Parsing the above just a little bit, we get into interesting territory. 59% of the White vote went for Romney.  The White vote was 72% of the total vote. And, we know that 48% of the electorate voted for Romney.  If we put these together, we get 72% of the total vote was White 59% of this group voted for Romney (or, 72 * 0.59 = 42.48% of the total vote was White and Voted for Romney ) 48% of the total vote was for Rom...

The only Election2012 Infographic worth a damn

Image
From the ever amazing Paul Crowley , we have this amazing Margin Bargraph (click to embiggen) Note that this is just an image, go to the original for an interactive original ... (Additional Information via Paul)----> To make sense of any of this you must understand the   Electoral College . Red states   are states that went for   McCain in 2008 . Blue states   are states that went for   Obama in 2008 . States in the band with a pale blue background at the top of the diagram have been called by the networks for Obama. States in the band with a pale red background at the bottom of the diagram have been called by the networks for Romney. States to the left   of the line are   projected to go for Obama . States to the right   of the line are   projected to go for Romney . The further left or right they extend, the further the projected margin of victory. The vertical direction is measured in   electoral votes The thicke...