Posts

Showing posts with the label statistics

Percentiles and Distributions

Image
/via https://flowingdata.com/2017/05/02/summary-stat/ If you don’t pay attention to your’ data’s distribution, you run the risk of focusing on the wrong thing entirely. The perfect examples here are  the datasets generated by Justin Matejka & George Fitzmaurice  (•), where, thought wildly different, each dataset has the same summary statistics (mean, standard deviation, and Pearson’s correlation) to 2 decimal places! To really belabor this point, absent knowledge of the actual distribution, you  shouldn’t  rely on baseline summary statistics. Take  averages  for example: 1.  Outliers can — wildly! — skew your averages. You walk to work 200 days a year, and fly cross-country to the HQ in Los Angeles once a year. What’s the average distance to work? 2.  On the other hand, you averages can — totally — hide your outliers. Your DMV processes 290 out of 300 applications in less than 15 minutes, but the other ten take greater than 2 hours....

Earth Mover’s Distance

Image
S ay you’ve got a pile of dirt over   here , and you want to move it over   there , what is the minimum cost of doing so? ( For the purposes of this discussion, assume that cost is the amount of dirt to be moved times the distance it is moved. ) Take this 10ft wide pile of gravel, for example. If you wanted to move it 100ft away, you’d have to pick the whole thing up, and move it over, right? OTOH, if you just wanted to shift it by 1ft, you can just rearrange the pile a wee bit, by moving some of the dirt over to the right, basically the overlapping part (in red) alone.   The generalization of this solution — the distance between two probability distributions — is called the   Earth Mover’s Distance   (in statistics. In mathematics, it’s called the   Wasserstein Metric . Because…math). It’s an incredibly useful thing, and can be applied to all sorts of fun stuff like   machine learning ,   gerrymandering , and more. For more, take a...

Pie Charts are Awesome!

Image

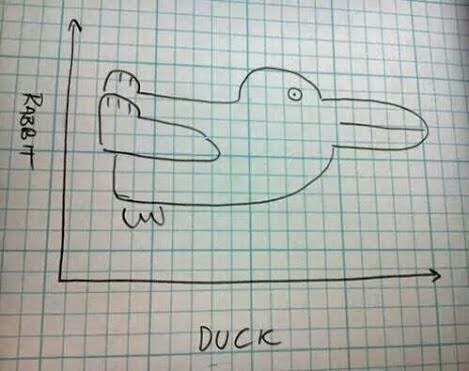
Proper labeling of axes is *crucial*

Image
via @pascallisch

Bringing the Pain to Statistical Modelling

Image
via SMBC