Posts

Showing posts with the label Census

Race & Sex on American TV - a #Visualization

Image
Amptoons puts Alyssa Rosenberg's count of the race and sex of characters on prime-time TV up against the same for the USA as a whole.  The conclusions? Asian & Latinos get short shrift  Law Enforcement is all over the place Check it out...

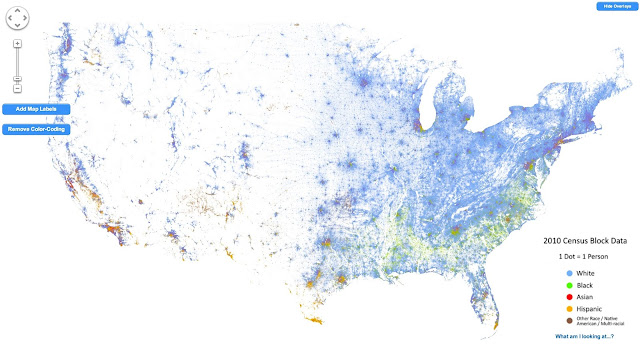
America - Visualized as a Racial Dot Map

Image
Dustin Cable does the honors here - mapping the population of the USA as a dot-map. Literally a dot-map, as in one dot per person .  This is not unlike the original dot map , but the coloring provides a racial breakdown. I still find it fascinating how pretty much the entire Western USA is empty... Anyhow, as he puts it This map is an American snapshot; it provides an accessible visualization of geographic distribution, population density, and racial diversity of the American people in every neighborhood in the entire country. The map displays 308,745,538 dots, one for each person residing in the United States at the location they were counted during the 2010 Census. Each dot is color-coded by the individual's race and ethnicity. The map is presented in both black and white and full color versions. In the color version, each dot is color-coded by race. All of the data displayed on the map are from the U.S. Census Bureau's 2010 Summary File 1 dataset made publicly available...

The American Population - Visualized (as a dotmap)

Image
Brandon Martin-Anderson does the heavy lifting, mapping every single person counted in the 2010 census . Thats 308,450,225 dots (technical term - "a lot of dots").  The image above is just that - an image.  Go to the source to see the actual - interactive - visualization . From the source What's all this? This is a map of every person counted by the 2010 US Census. The map has 308,450,225 dots - one for each person. Why? I wanted an image of human settlement patterns unmediated by proxies like city boundaries, arterial roads, state lines, &c. Also, it was an interesting challenge. Who is responsible for this? The US Census, mostly. I made the map. I'm   Brandon Martin-Anderson. Kieran Huggins   came to the rescue with spare server capacity and technical advice after this got Boing Boing'd. How? I wrote a Python script to generate points from US Census block-level counts, and then generated the tiles with Processing. Here's   more deta...