The Popular Vote - Deconstructed by Ethnic Diversity
CNN, strangely, has some gems buried in its exit polling data from the 2012 elections. I say strangely, because they seem to have gone full "faux wonk" in their attempt to be The Data Company, or whatever the heck their current strategy is.
Anyhow, the particularly interesting bit here is the chart showing Vote By Race, which I've summarized below
Parsing the above just a little bit, we get into interesting territory.
59% of the White vote went for Romney. The White vote was 72% of the total vote. And, we know that 48% of the electorate voted for Romney. If we put these together, we get
Thankfully, Slate has summarized this quite handily in a single chart
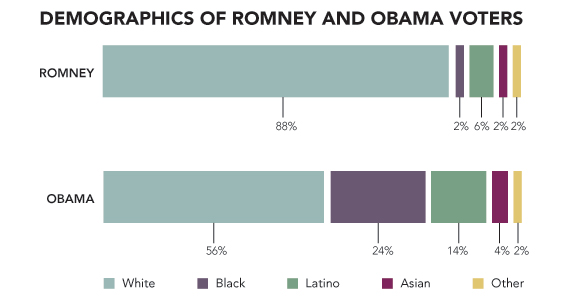
The bottom line is somewhat inescapable, especially as our nation grows more ethnically diverse, any long term electoral success must come from appealing to ethnic groups other than whites...
Anyhow, the particularly interesting bit here is the chart showing Vote By Race, which I've summarized below
| Vote by Race | Percentage of Vote | % Split for Obama | % Split for Romney | Other |
| White | 72 | 39 | 59 | 2 |
| African-American | 13 | 93 | 6 | 1 |
| Latino | 10 | 71 | 27 | 2 |
| Asian | 3 | 73 | 26 | 1 |
| Other | 2 | 58 | 38 | 4 |
Parsing the above just a little bit, we get into interesting territory.
59% of the White vote went for Romney. The White vote was 72% of the total vote. And, we know that 48% of the electorate voted for Romney. If we put these together, we get
- 72% of the total vote was White
- 59% of this group voted for Romney (or, 72 * 0.59 = 42.48% of the total vote was White and Voted for Romney)
- 48% of the total vote was for Romney
- Therefore, the percentage of Romney's Vote that was White = 42.48/0.48 = 88.5%
- the percentage of Obama's Vote that was White = 72*0.39/0.50 = 56%
- the percentage of Romney's Vote that was Latino = 27*0.10/0.48 = 5.6%
- the percentage of Obama's Vote that was Latino = 71*0.10/0.50 = 14.2%
Thankfully, Slate has summarized this quite handily in a single chart
The bottom line is somewhat inescapable, especially as our nation grows more ethnically diverse, any long term electoral success must come from appealing to ethnic groups other than whites...


Comments