Gender Balance in Conferences - Visualized
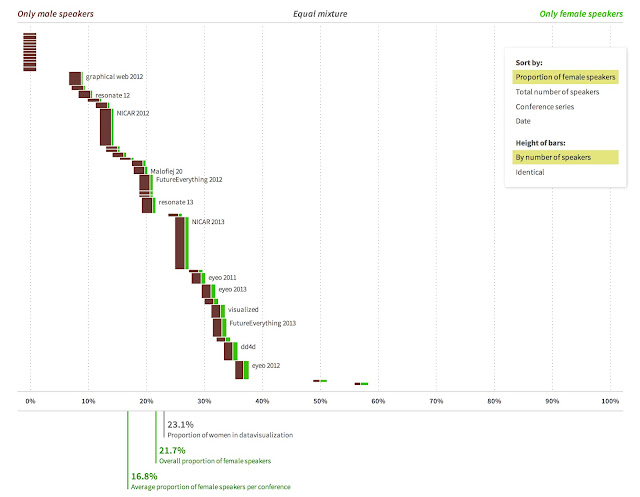
Moritz Stefaner started tracking male vs. female speakers at conferences that he went to, and that evolved into this handy-dandy chart on gender balance in conferences on data visualization (handy!), creative code, and information graphics.
The bottom line - its better than I expected, but seriously, that is not saying much (the Erlang / Functional Programming / NoSQL world is heavily skewed towards male speakers...).
Here hoping for a far more equitable future...
(click to embiggen. Better yet, go to the original for the fully interactive version)


Comments