You already grok these latency numbers, right?

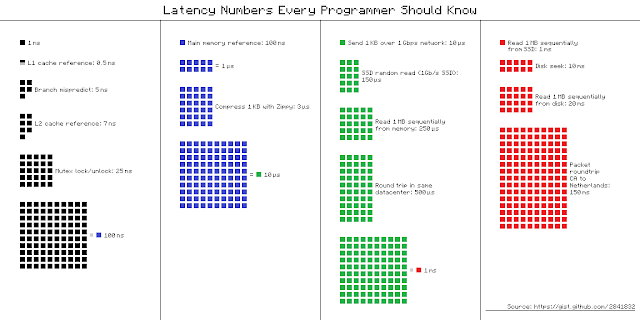
From Jonas Boner, Jeff Dean, and Peter Norvig, we have this awesome gist showing latency numbers for different types of data access
The numbers pretty much speak for themselves, and its always good to hammer home exactly how bad a disk access is. That said, an L1 cache-miss is a 14x hit! Wild...

Latency Comparison Numbers (~2012)
----------------------------------
L1 cache reference 0.5 ns
Branch mispredict 5 ns
L2 cache reference 7 ns 14x L1 cache
Mutex lock/unlock 25 ns
Main memory reference 100 ns 20x L2 cache, 200x L1 cache
Compress 1K bytes with Zippy 3,000 ns 3 us
Send 1K bytes over 1 Gbps network 10,000 ns 10 us
Read 4K randomly from SSD* 150,000 ns 150 us ~1GB/sec SSD
Read 1 MB sequentially from memory 250,000 ns 250 us
Round trip within same datacenter 500,000 ns 500 us
Read 1 MB sequentially from SSD* 1,000,000 ns 1,000 us 1 ms ~1GB/sec SSD, 4X memory
Disk seek 10,000,000 ns 10,000 us 10 ms 20x datacenter roundtrip
Read 1 MB sequentially from disk 20,000,000 ns 20,000 us 20 ms 80x memory, 20X SSD
Send packet CA->Netherlands->CA 150,000,000 ns 150,000 us 150 ms
Notes
-----
1 ns = 10^-9 seconds
1 us = 10^-6 seconds = 1,000 ns
1 ms = 10^-3 seconds = 1,000 us = 1,000,000 ns
Credit
------
By Jeff Dean: http://research.google.com/people/jeff/
Originally by Peter Norvig: http://norvig.com/21-days.html#answers
Contributions
-------------
'Humanized' comparison: https://gist.github.com/hellerbarde/2843375
Visual comparison chart: http://i.imgur.com/k0t1e.png
Interactive Prezi version: https://prezi.com/pdkvgys-r0y6/latency-numbers-for-programmers-web-development/latency.txt
view raw latency.txt hosted with ❤ by GitHub

Heres the same data visualized (from ayshen)...
(click to embiggen)


Comments

Popular posts from this blog

Cannonball Tree!